SOLAR INVERTER BUYER GUIDE
Solar Inverter Clipping: When a Flat Power Curve Is Normal and When to Investigate
Share on social media
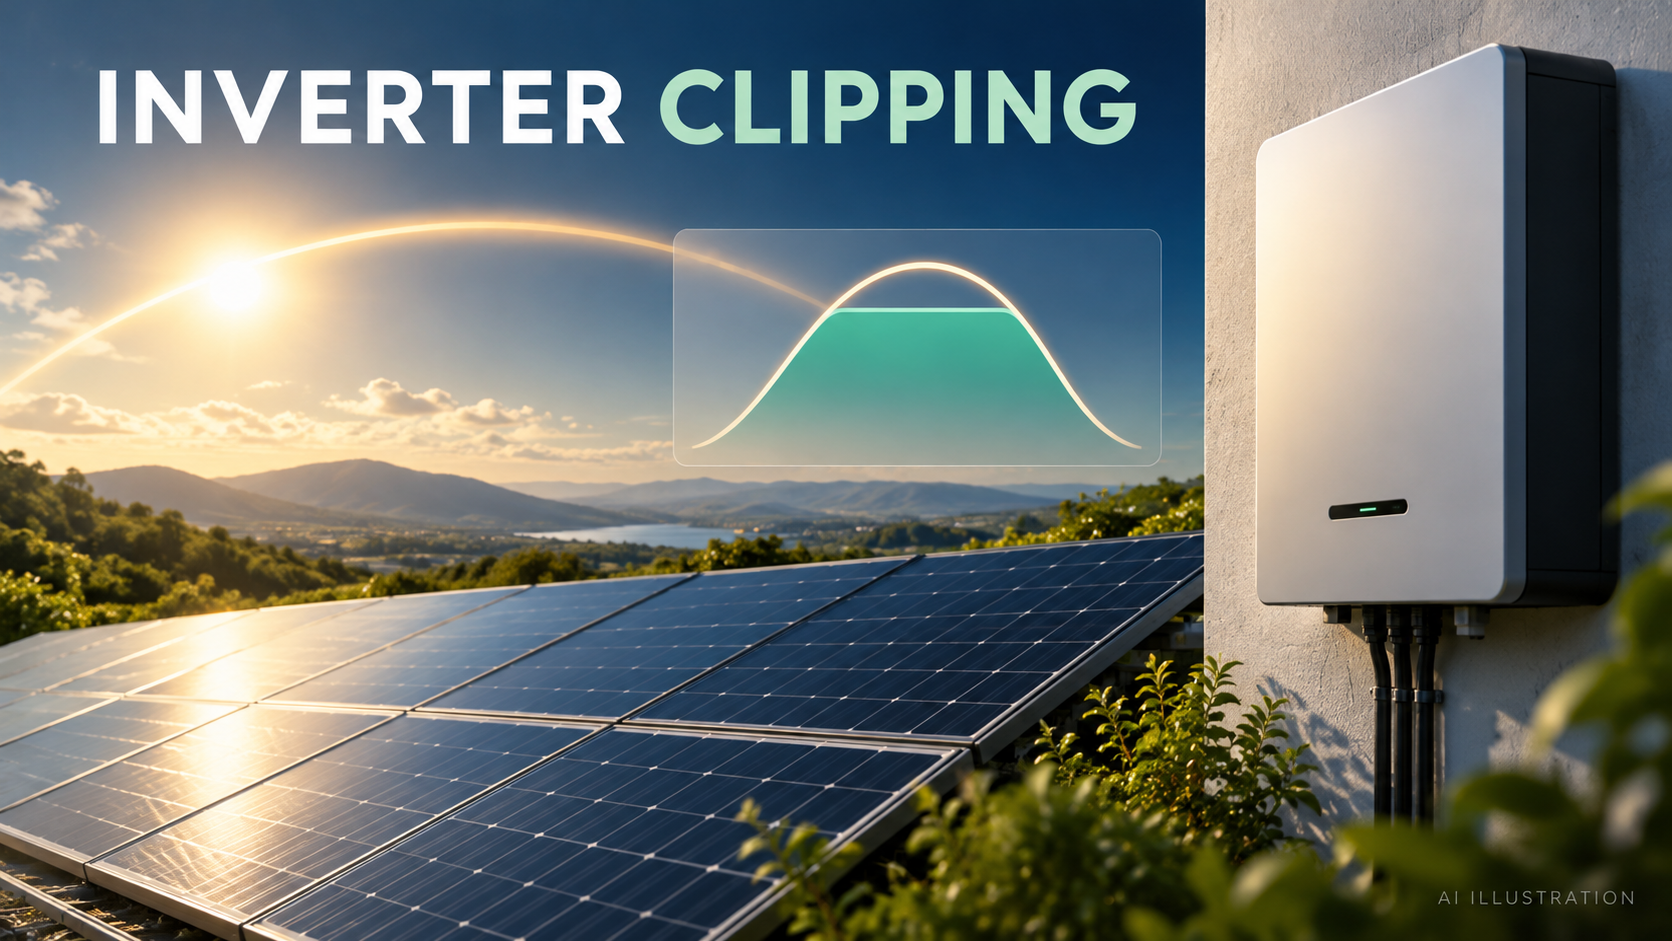
Learn why inverter output can plateau, how to distinguish expected clipping from other limits, and what evidence to request before changing equipment.
A flat top is a clue, not a diagnosis
Your solar monitoring graph rises through the morning, forms a level plateau, then falls in the afternoon. It is reasonable to ask whether the inverter is wasting electricity or the system has a fault. The graph alone cannot answer that question.
A plateau can be consistent with normal inverter clipping, but other operating limits can also reduce output. Start by identifying what the chart measures, the inverter's applicable power ceiling and any events recorded at the same time. Replacing equipment before those checks can solve the wrong problem.
What clipping actually means
Clipping occurs when available PV power would require more AC output than the inverter can deliver, so the inverter limits conversion. SolarEdge's oversizing technical note describes this limit and explains that the array's nominal DC capacity can exceed the inverter's AC rating. The allowable relationship remains model-specific. [1]
Clipping is not evidence that all the unharvested potential becomes extra heat inside the inverter. SAM's PVWatts documentation explains power limiting through a shift in the array's operating point; its model caps AC output at the inverter rating. Normal conversion losses still exist. [2]
For an illustrative comparison, an array's panel-nameplate total and the inverter's AC rating are different quantities. A larger panel total does not promise that same number on the AC graph. Actual module output changes with sunlight, temperature and site conditions. [1]
Why a designer may accept some clipping
Additional PV capacity can raise production during periods when the inverter is below its ceiling. A designer may accept some peak-time clipping to gain energy at other times. That trade-off should be assessed over the year, rather than judged from one impressive or disappointing noon reading. [1][2]
There is no universal clipping percentage that proves every installation is well designed. Request an estimate based on the roof orientation, local weather data, shading, equipment and operating constraints. Ask how the proposed option compares with a different inverter size, using annual usable energy and the extra cost rather than nameplate capacity alone.
Oversizing also has boundaries. SMA's planning guidance distinguishes usable input current from short-circuit limits and requires compliance with voltage and permitted PV-power conditions. Planned clipping never grants permission to ignore electrical limits or warranty requirements. [3]
Check other explanations before calling it normal
Thermal derating is a separate mechanism. An inverter may reduce power to protect its components when heat cannot be removed adequately. SMA identifies installation conditions, direct sunlight and ambient temperature among the relevant factors. In Pakistan's hot conditions, the installer should check the model's thermal guidance and required clearances rather than assume every midday reduction is ordinary clipping. [4]
A configured output ceiling can also create a repeatable plateau below the inverter's nominal rating. Solis documents active-power limiting as a configurable function. Ask the installer to identify the approved settings; do not raise them merely to make the graph look better. [5]
Grid-related alarms deserve their own investigation. Solis's service guidance confirms that its inverters monitor AC voltage and frequency and report out-of-range conditions. Alarm meanings and permitted settings depend on the model and jurisdiction. Foreign grid-profile instructions are not a substitute for the approved local configuration. [6]
Build a useful evidence pack
Before contacting the installer, collect information available through your normal monitoring access:
- The full inverter model, installed PV capacity and original production estimate.
- Several dated graphs, including a clear day and a day when the behaviour differs.
- Whether the graph shows PV input, inverter AC generation, household consumption or grid exchange.
- The displayed units: power in kW and energy in kWh answer different questions.
- The plateau level, its duration and any event messages with matching timestamps.
- Any recent equipment, shading, monitoring or operating-setting changes.
Ask the installer to reconcile this evidence with the design and commissioning records. The important finding is the reason for the limit, not whether a graph resembles an example online.
When to investigate further
A repeatable plateau near the documented AC ceiling, with no concerning events and energy production consistent with the design, can support an explanation of expected clipping. That remains an interpretation to verify, not a diagnosis from shape alone.
A newly lower ceiling, repeated alarms, unexpected shutdowns or a sustained shortfall against a weather-aware estimate deserves professional review. Thermal warnings should be checked against the installation and model guidance. Do not open the inverter, disconnect PV connectors or alter protective settings to test a theory.
The goal is a system that delivers the expected useful energy safely. A perfectly rounded power curve is not, by itself, a better investment than a correctly designed system with some planned clipping.
Sources and references
- [1] SolarEdge: Technical Note – Oversizing of SolarEdge Inverters, version 1.1, October 2023
- [2] System Advisor Model: PVWatts System Design documentation
- [3] SMA commercial system planning: Preconditions for the oversizing of the PV system power
- [4] SMA: SUNNY BOY / SUNNY TRIPOWER Temperature Derating, technical information version 1.5
- [5] Solis Service Center: Control Maximum Active Power Generation
- [6] Solis North America: Grid Alarms service guidance, updated 18 December 2025