SOLAR INVERTER BUYER GUIDE
Solar Inverter Efficiency: Peak, Weighted and Real Operating Conditions
Share on social media
Learn which efficiency figures can be compared, why part-load behavior and standby consumption matter, and how to question energy-yield promises.
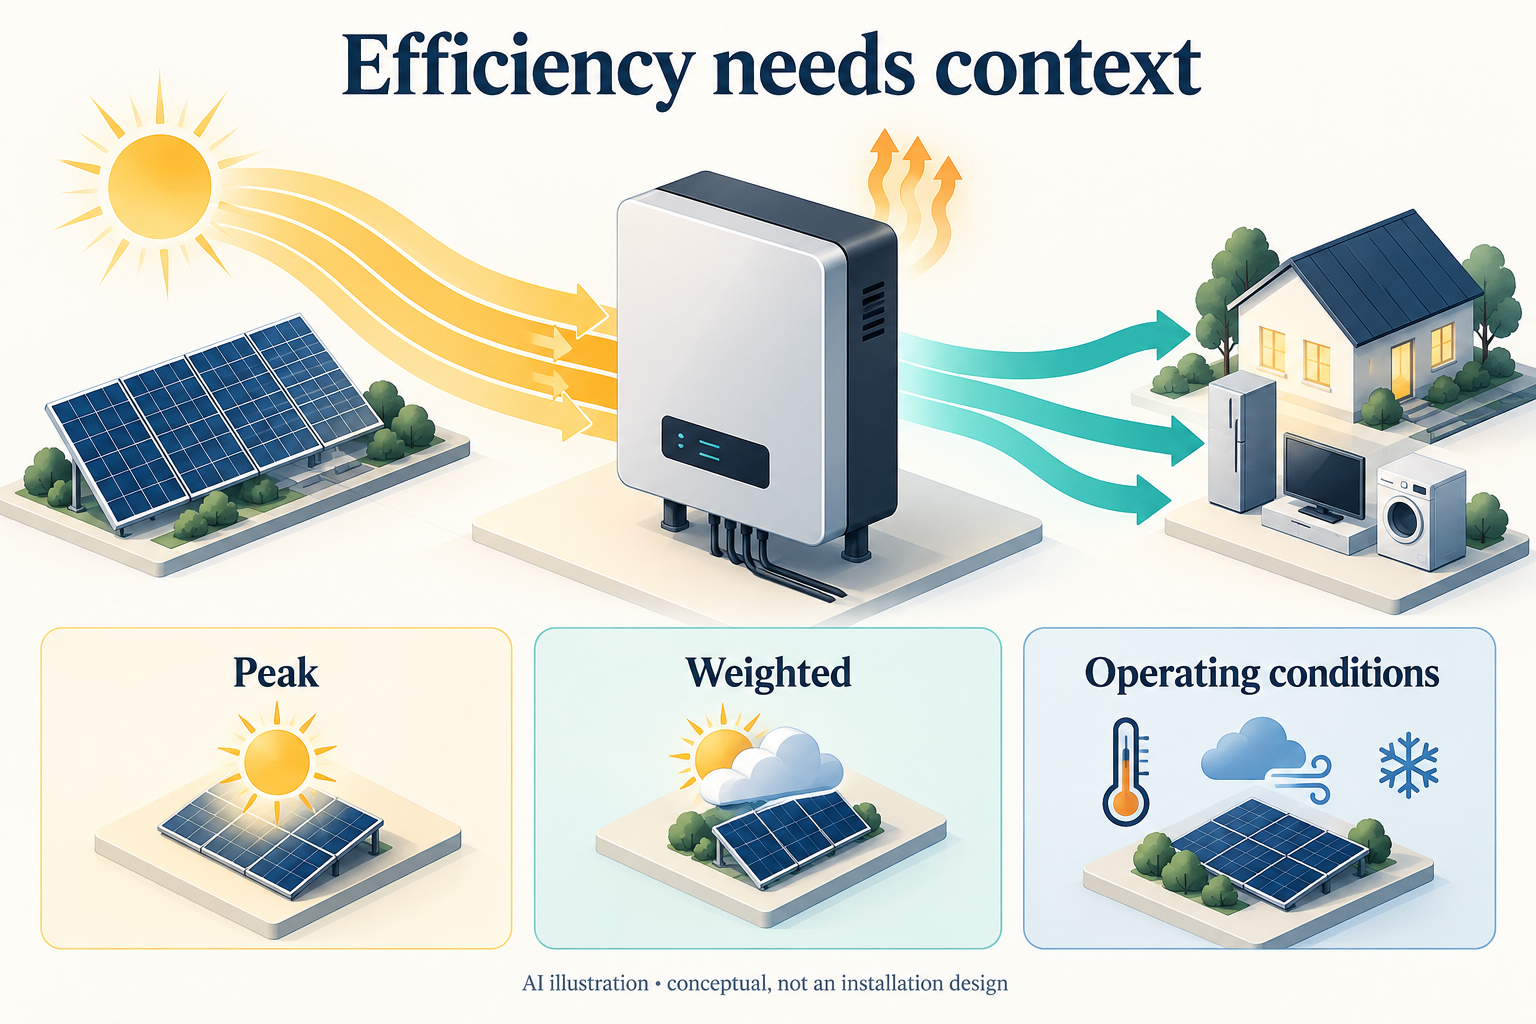
A high percentage needs a clearly defined boundary
A quotation showing 98% inverter efficiency can look reassuring, but the number needs a label. Is it peak DC-to-AC conversion efficiency, a weighted result across several loads, or a different energy path within a hybrid system?
For a Pakistani solar buyer, the useful comparison starts with the exact model and the same measurement basis. Comparing one manufacturer's peak figure with another's weighted figure can reward the presentation rather than the equipment. A conversion-efficiency percentage alone is not an annual production forecast.
Peak efficiency describes a favourable operating point
Conversion efficiency is output power divided by input power across the stated conversion stage. SMA's technical document defines maximum efficiency at the rated input voltage and publishes efficiency curves at different input voltages and loads. [1]
Illustrative calculation: if an inverter receives 4,000 W of DC power and delivers 3,920 W of AC real power at the same operating point, its DC-to-AC efficiency is 98%. The 80 W difference is conversion loss within that defined boundary. These are hypothetical numbers, not measured results for a product.
The calculation does not say that 98% of the sunlight striking the roof reaches the home. Module conversion, shading, wiring and other system effects sit outside that narrow comparison. It also does not establish the inverter's efficiency at every other load.
Weighted efficiency combines several operating points
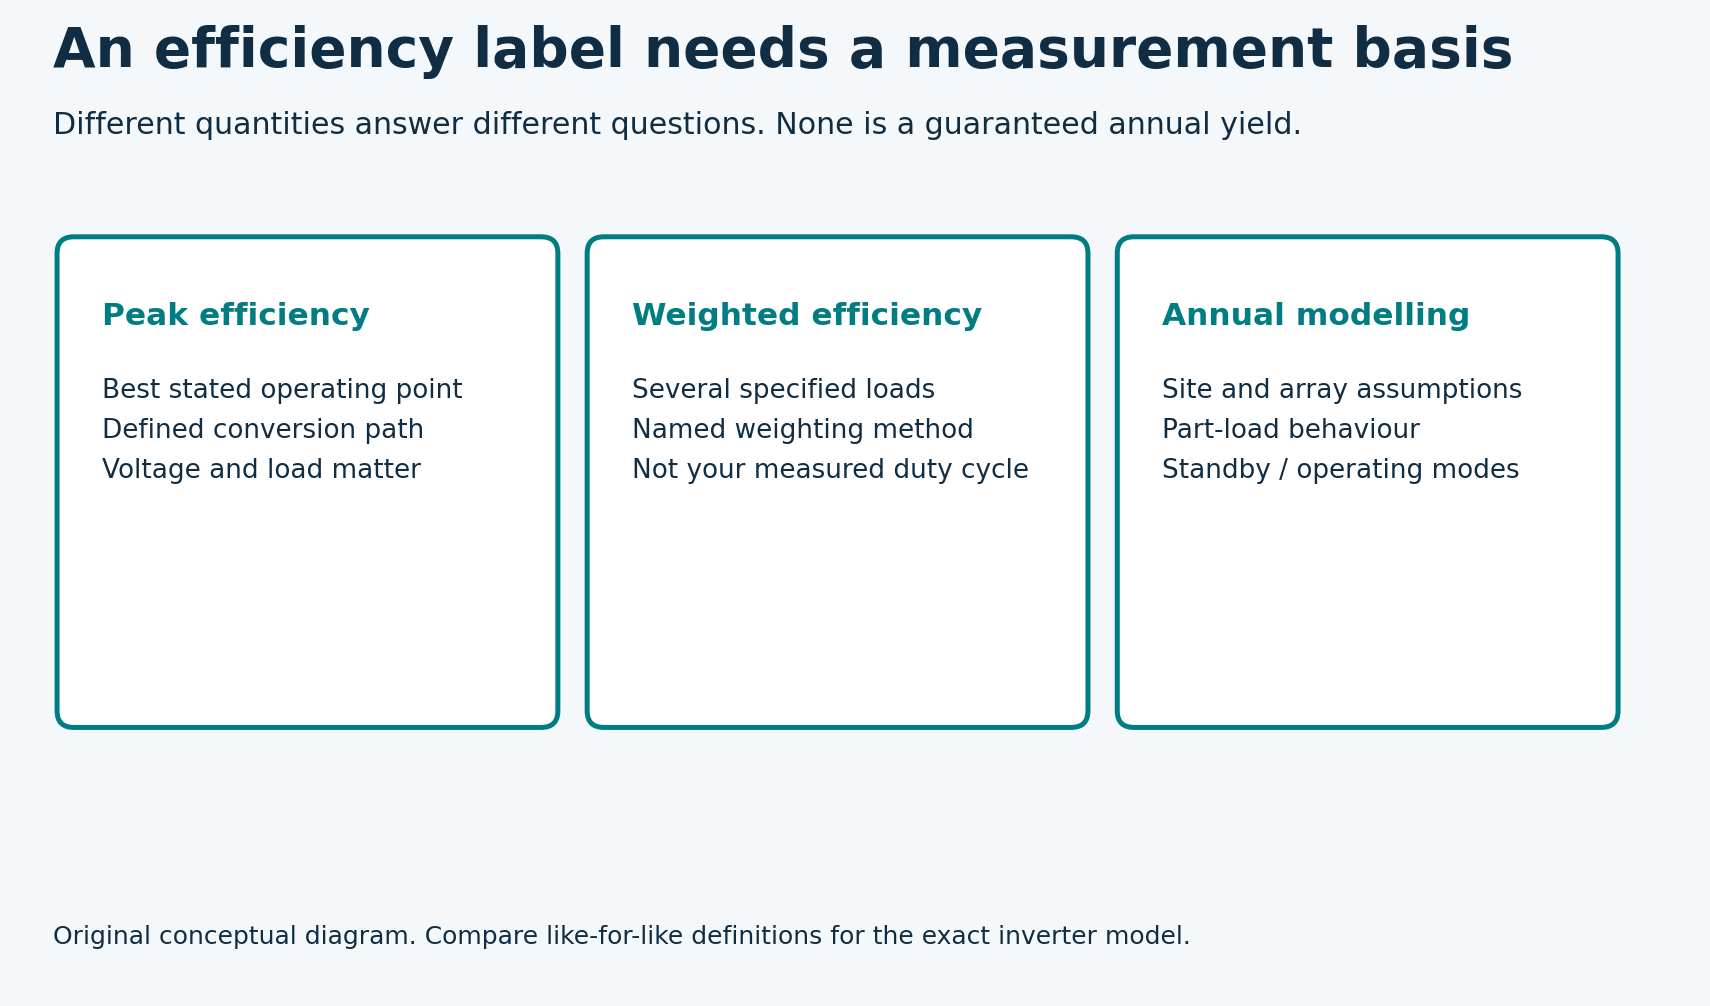
European and California Energy Commission, or CEC, weighted efficiencies combine efficiencies at specified fractions of rated power. Their weighting patterns are different, so they should be identified explicitly rather than grouped under a vague “average efficiency” heading. [1][2]
For example, the European calculation gives a 48% weight to the efficiency measured at 50% load. That does not mean your inverter will spend exactly 48% of its time at half load. It is part of a standard comparison method, not an observation about your roof. [1]
SAM's documentation generally prefers an available weighted figure over a single nominal efficiency when using its datasheet model. It associates the European method with lower-load solar conditions and the CEC method with higher-load conditions. Neither replaces site-specific modelling for a particular Pakistani installation. [2]
Original companion diagram
Part-load operation deserves attention
An inverter does not operate at one power level all day. Its conversion behavior also depends on input voltage. Sandia's modelling guidance explicitly uses DC input power and voltage to predict AC output, rather than applying one best-case percentage everywhere. [3]
Ask for the efficiency curve or part-load table for the exact variant being offered. Look at the operating region your proposed array is expected to use, not just the highest point on the graph. If the proposal is for a hybrid system, ask the supplier to identify the relevant efficiency for direct solar supply, battery charging and battery discharge where those figures are available.
Those are separate questions about the energy route. A number specified for one route should not silently be applied to all of them. A qualified designer can explain the boundary and identify missing data without inventing a reassuring percentage.
Standby consumption is an energy quantity over time
SAM distinguishes power consumed during conversion from nighttime consumption when the array is not generating. Its documentation warns that these are different parameters; counting a daytime loss twice can also distort a model. [2]
Illustrative calculation: an assumed constant standby draw of 10 W for 12 hours each night uses 0.12 kWh per night, or 43.8 kWh over 365 identical nights. A 20 W assumption over the same hours gives 87.6 kWh. These figures are arithmetic examples, not typical ratings or predictions for any named inverter.
Before applying them to a quotation, establish what mode the specification describes and how long the equipment is expected to remain in it. A hybrid inverter actively supplying household loads overnight is not necessarily in the same state as a grid-connected solar inverter waiting for sunrise.
Annual yield needs more than an efficiency badge
An annual energy estimate should combine the relevant weather, array layout and equipment behavior. Sandia's PV performance guidance identifies inputs such as location, orientation, shading, soiling and electrical losses alongside inverter characteristics. [4]
Ask the installer to compare candidate models using the same system assumptions and disclose the expected difference in annual kilowatt-hours. A very small efficiency difference should not be described as a large guaranteed bill saving without the energy calculation and the applicable consumption assumptions.
Also separate uncertainty from precision. A quotation showing several decimal places is not automatically more accurate than one giving a sensible range. Request the data source and modelling assumptions behind the result, especially if the seller claims a particular model is universally the most efficient choice.
A practical quotation checklist
Before deciding, request:
- The exact inverter model and datasheet revision.
- Peak and weighted efficiencies, with the method named.
- Part-load curves or test data and their voltage conditions.
- Standby consumption with the operating mode defined.
- Clearly identified energy paths for hybrid-system claims.
- A comparable annual energy estimate, not only a headline percentage.
Do not open an inverter or probe live terminals to check a sales claim. Have qualified personnel investigate suspected losses with suitable measurements. The best buying decision comes from comparable evidence and a well-defined system, rather than the largest efficiency number on a brochure.