SOLAR MONITORING GUIDE
Solar App Offline or Wrong Data? A Homeowner’s Monitoring Checklist
Share on social media
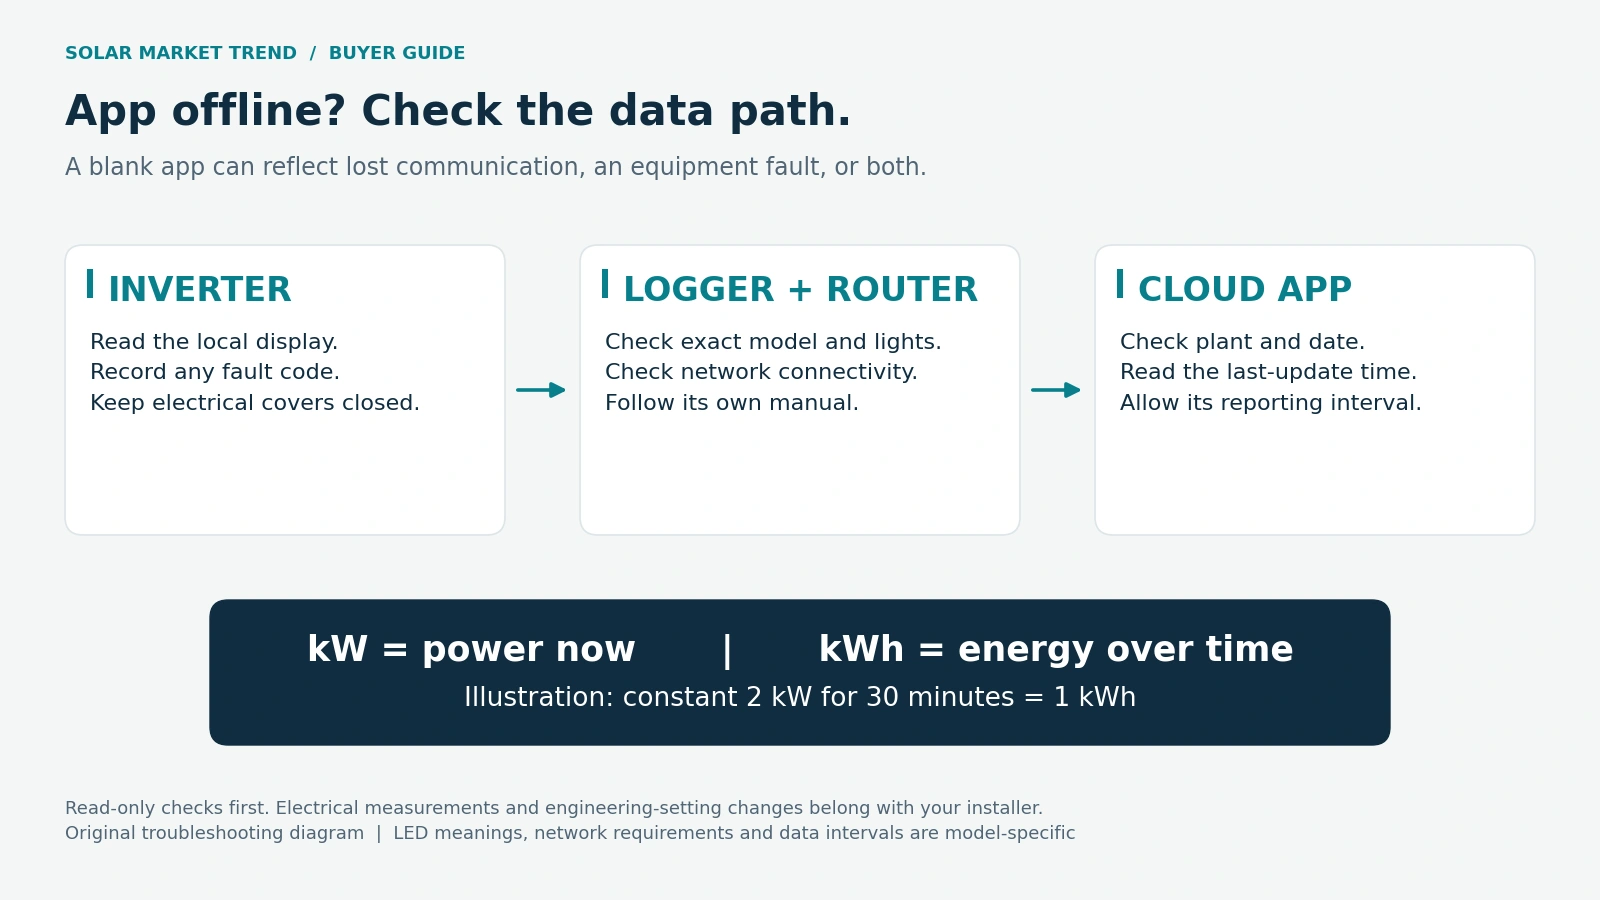
You open the solar app after lunch and see zero generation, an offline warning or a strange spike in grid use. Before assuming the installation has failed, establish which part of the information chain has stopped updating.
For a home in Pakistan, a router interruption, changed Wi-Fi details or stale cloud reading can create a monitoring problem alongside an otherwise operating inverter. An inverter fault is also possible. The first useful check is a timestamp and a safe look at the equipment's own display.
Identify the three links in the chain
Monitoring usually involves the inverter, a communications device such as a Wi-Fi or Ethernet logger, and an online platform. Some products integrate parts of this chain. Read the exact inverter and logger manuals rather than buying a replacement dongle based only on its connector shape.
Sungrow's WiNet-S/S2 manual distinguishes local operation-data access from network configuration and cloud communication. It also specifies device compatibility and network requirements for those modules. Sungrow WiNet-S/S2 manual
If the local display reports normal production while the app's timestamp is old, investigate communications first. If both show a fault, record the fault code and ask the installer to assess it. Avoid opening covers, disturbing electrical connectors or changing operating settings to diagnose a missing graph.
Use this offline checklist
- Confirm the app is showing the correct plant and date. Note when its data last updated.
- Check whether your phone can access the internet through the same home router.
- Recall any recent router replacement, Wi-Fi-name change or password change.
- Read the logger's indicator lights against its own manual. Colours and flashing patterns vary.
- Check the supported wireless band and signal at the inverter location.
- Allow the documented reporting interval after normal connectivity returns.
For example, the cited WiNet manual requires a 2.4 GHz wireless network for its wireless setup. That is a model-specific requirement, not proof that every solar logger has the same capability. If configuration is necessary, use the official app or installer support. Do not disable router security or share account passwords to obtain a connection.
Read kW and kWh differently
A power reading in kW describes a rate at a point in time. Energy in kWh adds consumption or generation over a period. Storage guidance from the US Department of Energy makes the same power-versus-energy distinction. DOE explanation
As an illustrative calculation, a constant 2 kW output for 30 minutes produces:
Energy = power × time = 2 × 0.5 = 1 kWh
A screenshot showing 2 kW does not establish what the system produced throughout the previous half-hour. Compare daily kWh with daily kWh, and ensure the date, timezone and reporting boundary match. Pakistan Standard Time is UTC+5; a wrongly configured plant timezone can make daily comparisons confusing.
A five-minute point may be a snapshot
Do not automatically treat every point on a cloud graph as the average for the preceding interval. Solis states that the five-minute values described in its support article are instantaneous snapshots, which can capture a load change or the inverter's response to it. SolisCloud data explanation
Here is an original illustration: a 2 kW kettle used for two minutes consumes about 0.067 kWh. A five-minute snapshot might catch it running or miss it entirely. Multiplying every snapshot by five minutes would therefore not necessarily reproduce the true energy used. Prefer the platform's accumulated energy counters for totals, while confirming what those counters actually measure.
The same caution applies to a brief import spike. Examine repeated behaviour and longer-period totals before concluding that the system is operating incorrectly.
Missing history and impossible power flows
Some loggers store data locally and upload it after connectivity returns. Solis documents this capability for specified logger models, with storage depending on the configuration. Check whether your exact logger supports backfilling before assuming a blank historical period is permanent. Solis offline-data guidance
Persistent negative household consumption or implausible import/export readings deserve an installer check. Meter placement, current-transformer direction and phase matching can affect the displayed power flow. Solis's technical guidance explains these measurement dependencies. Solis meter-verification guide
These are electrical commissioning checks. A homeowner should not reposition clamps or enter engineering settings to make the picture look right. Sign conventions also vary, so a minus sign alone is not a diagnosis.
Send support a useful evidence pack
Provide the inverter and logger model, the last-update time, a screenshot of the app, the local display reading and any fault code. Note whether the router changed and when the issue began. Keep serial numbers and account details out of public posts. This short record helps support distinguish a connectivity problem, a measurement issue and a genuine operating fault.
Editorial note: AI-assisted, source-checked buyer guidance. Sources checked 14 October 2026.