SOLAR PANEL BUYER GUIDE
Solar Panel I–V Curves: What a Commissioning Trace Can and Cannot Diagnose
Share on social media
An I–V trace can expose a performance discrepancy, but a curve shape is not a unique fault diagnosis. Here is what a useful commissioning record should contain.
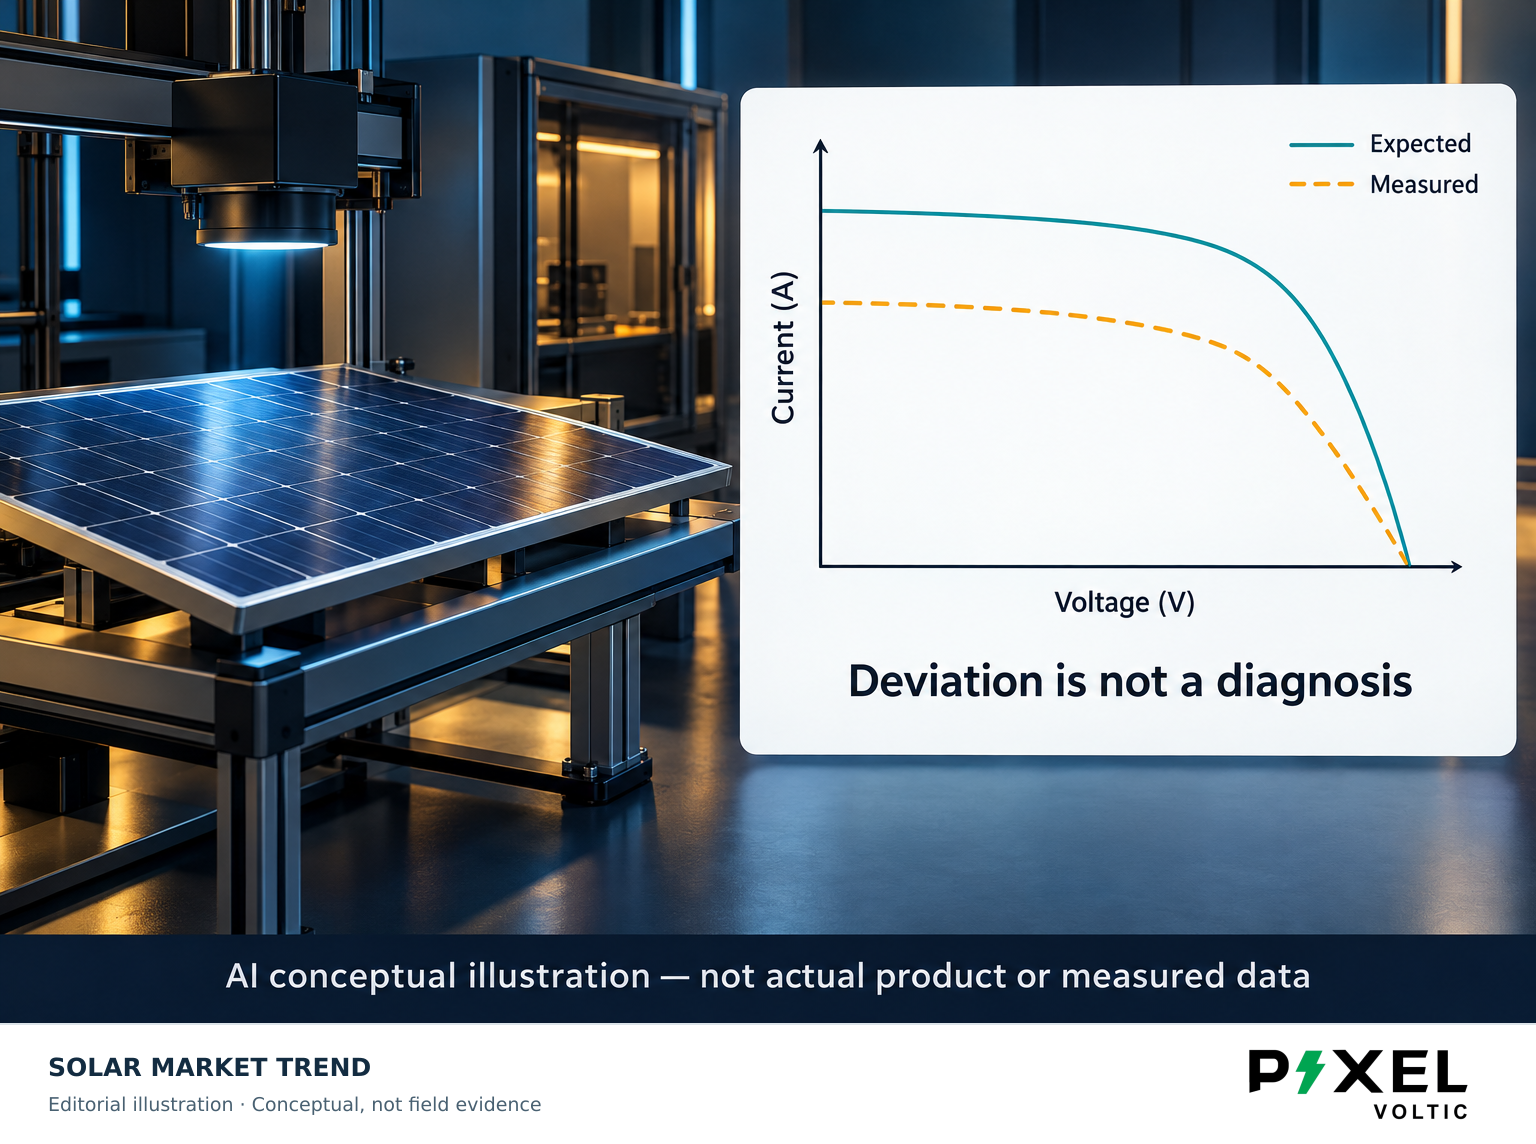
A commissioning report with a smooth solar-panel I–V curve looks reassuring. A distorted curve looks alarming. Neither appearance tells the whole story. A useful trace records electrical behaviour under documented conditions; it does not independently identify every defect or promise future energy production.
For a rooftop owner, the most valuable question is not “Does the graph look good?” It is “What comparison makes this result meaningful?”
Read the graph before reading the verdict
An I–V curve plots current against voltage across possible operating points. Its endpoints include short-circuit current and open-circuit voltage; the maximum-power point lies between them. The trace therefore contains more information than a single power reading. It can help compare a measured module or string with an expected response under the test conditions. Fluke explains that each measured current–voltage pair belongs to the irradiance and cell temperature prevailing during the sweep. Fluke’s technical explanation
This is a snapshot of the tested circuit. It is not a daily-generation chart, and a string-level discrepancy does not automatically identify which physical component caused it.
First establish that the comparison is fair
Fluke’s field-performance guidance stresses that irradiance in the array plane and cell temperature are needed to evaluate performance. Rapidly changing conditions can introduce errors. A neatly drawn graph cannot compensate for an unsuitable environmental measurement. Field-test guidance
Ask the commissioning provider to retain the measured conditions, test time, circuit identity and expected-curve basis alongside the trace. The comparison should explain which module specification and circuit configuration were used. Those records make later investigations more useful than a screenshot showing only “pass”.
Do not demand that an outdoor curve match a reference-condition datasheet without accounting for the conditions. Conversely, an unexplained correction factor should not be accepted merely because software generated it.
A deviation narrows the investigation
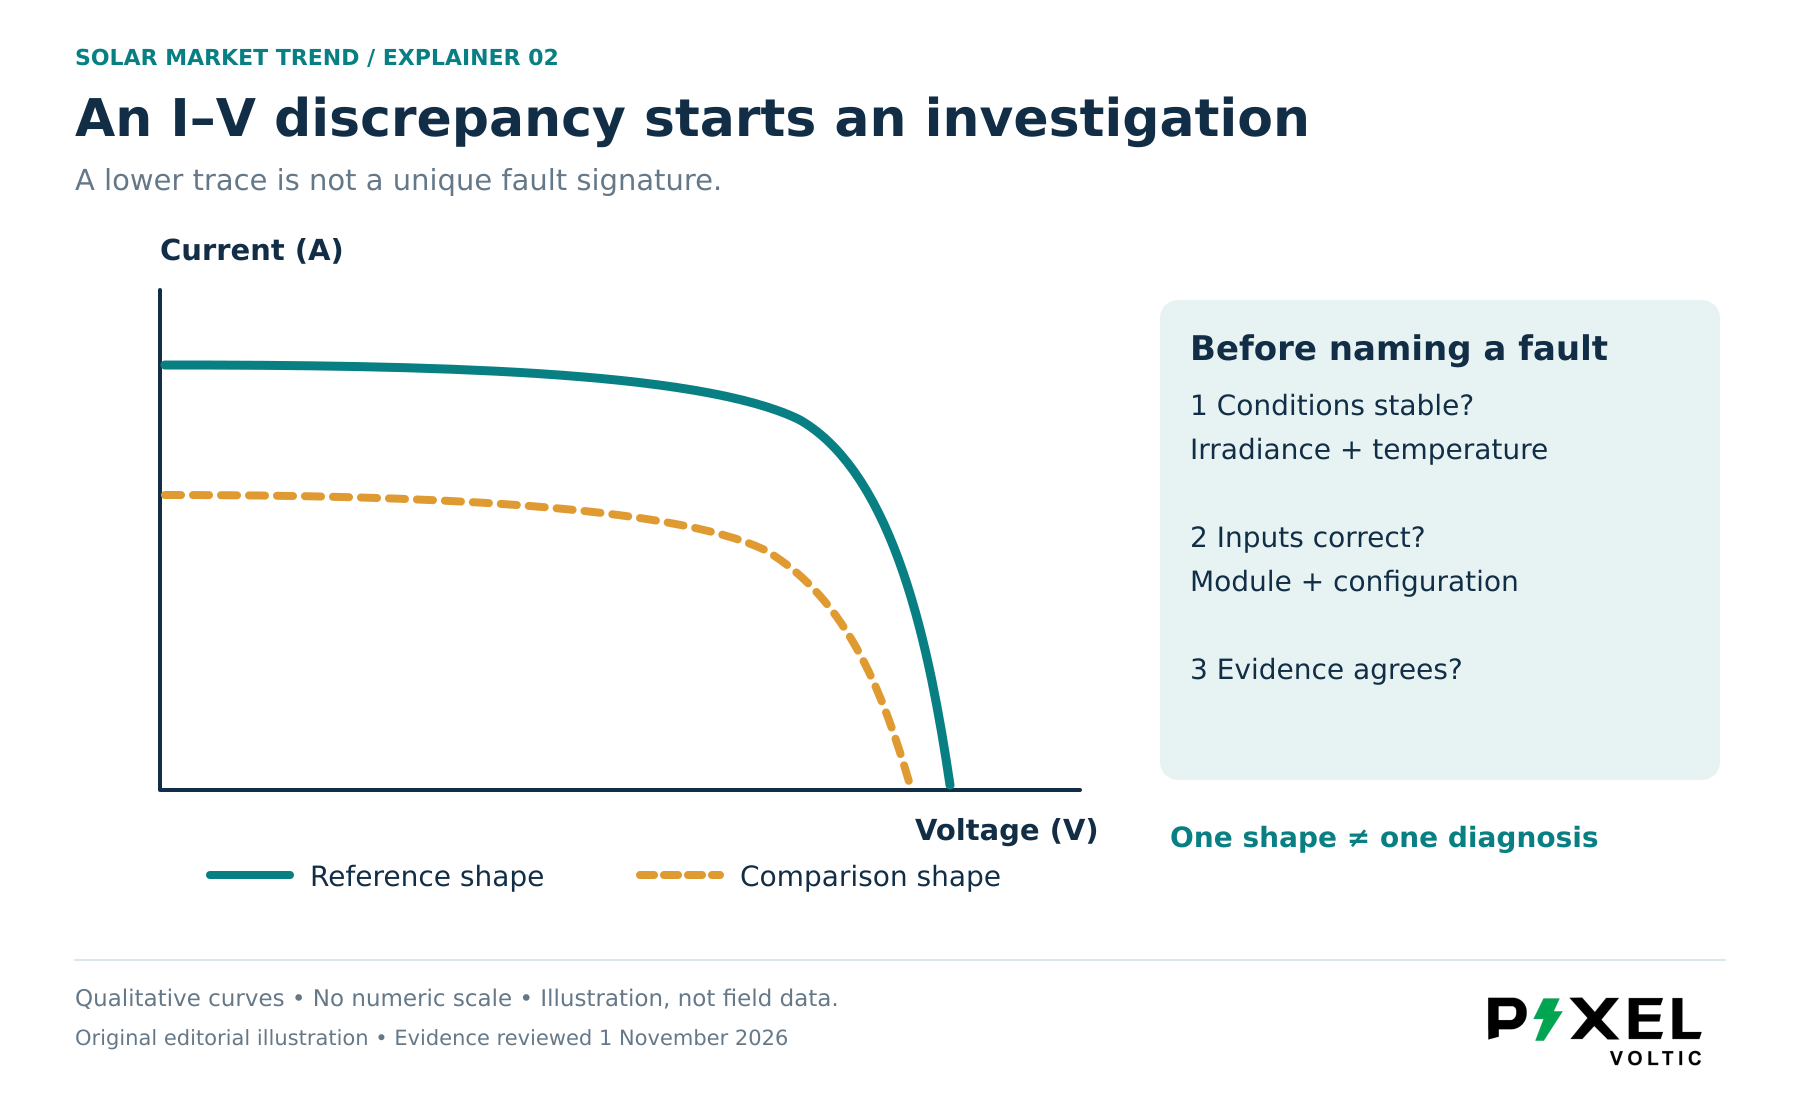
Fluke’s interpretation guide lists multiple explanations for low short-circuit current, including reduced light capture and irradiance-measurement error. Reduced open-circuit voltage also requires checking temperature and measurement assumptions before blaming module deterioration. Changes around the curve’s knee can point toward additional circuit resistance, but still need corroboration. Curve-interpretation guidance
The practical lesson is diagnostic restraint: a shape supports a hypothesis, not a unique verdict. Request the suspected cause, alternative explanations and the professional follow-up evidence. Avoid replacing panels solely because an isolated curve was labelled abnormal.
The instrument must suit the module
Modern high-efficiency modules introduce another complication. Fluke explains that module capacitance can distort a sweep performed too rapidly, shifting the apparent maximum-power point. Instrument compatibility and an appropriate measurement method therefore matter; a suspicious trace may reflect the test rather than a permanently faulty module. This is not permission to ignore a failed result—it is a reason to validate it. High-efficiency module testing
Keep commissioning separate from lifetime assurance
Sandia’s Regional Test Centers describe commissioning, monitoring, modeling, and reliability assessment as distinct activities. Their approach includes periodic testing because some problems may emerge after installation. One acceptable trace is a baseline, not proof of decades of trouble-free service. Sandia validation approach
For a Pakistani rooftop handover, ask for an interpretable test record and a clear escalation process, not simply a green badge. Testing and any circuit access belong to appropriately qualified personnel using suitable equipment. Owners should not disconnect energized PV connectors or improvise electrical tests.
The best commissioning curve is not the prettiest one. It is the one another competent professional can understand, compare and investigate later.
Sources and references
- [1] I–V curve tracing of high efficiency solar panels
Fluke
- [2] A Guide to PV Circuit Performance
Fluke
- [3] How to analyze an I–V curve
Fluke
- [4] Technical Approach to Validation
Sandia National Laboratories